Discovery Engineering SEO Case Study: 22.3x Higher Estimated Organic Traffic
If you run a specialized service business, search visibility can stay flat for years even when the company is strong offline. Discovery Engineering is a good example. The firm had a real history, a real market, and a technical service offering, but its organic visibility was limited before the SEO engagement began.
This case study looks at the before-and-after search visibility pattern for Discovery Engineering using Semrush Organic Research data from May 2016 through June 2026. The engagement began in April 2024, so the analysis separates the long pre-engagement period from the months after the work started.
Contents
Starting point: years of low organic visibility
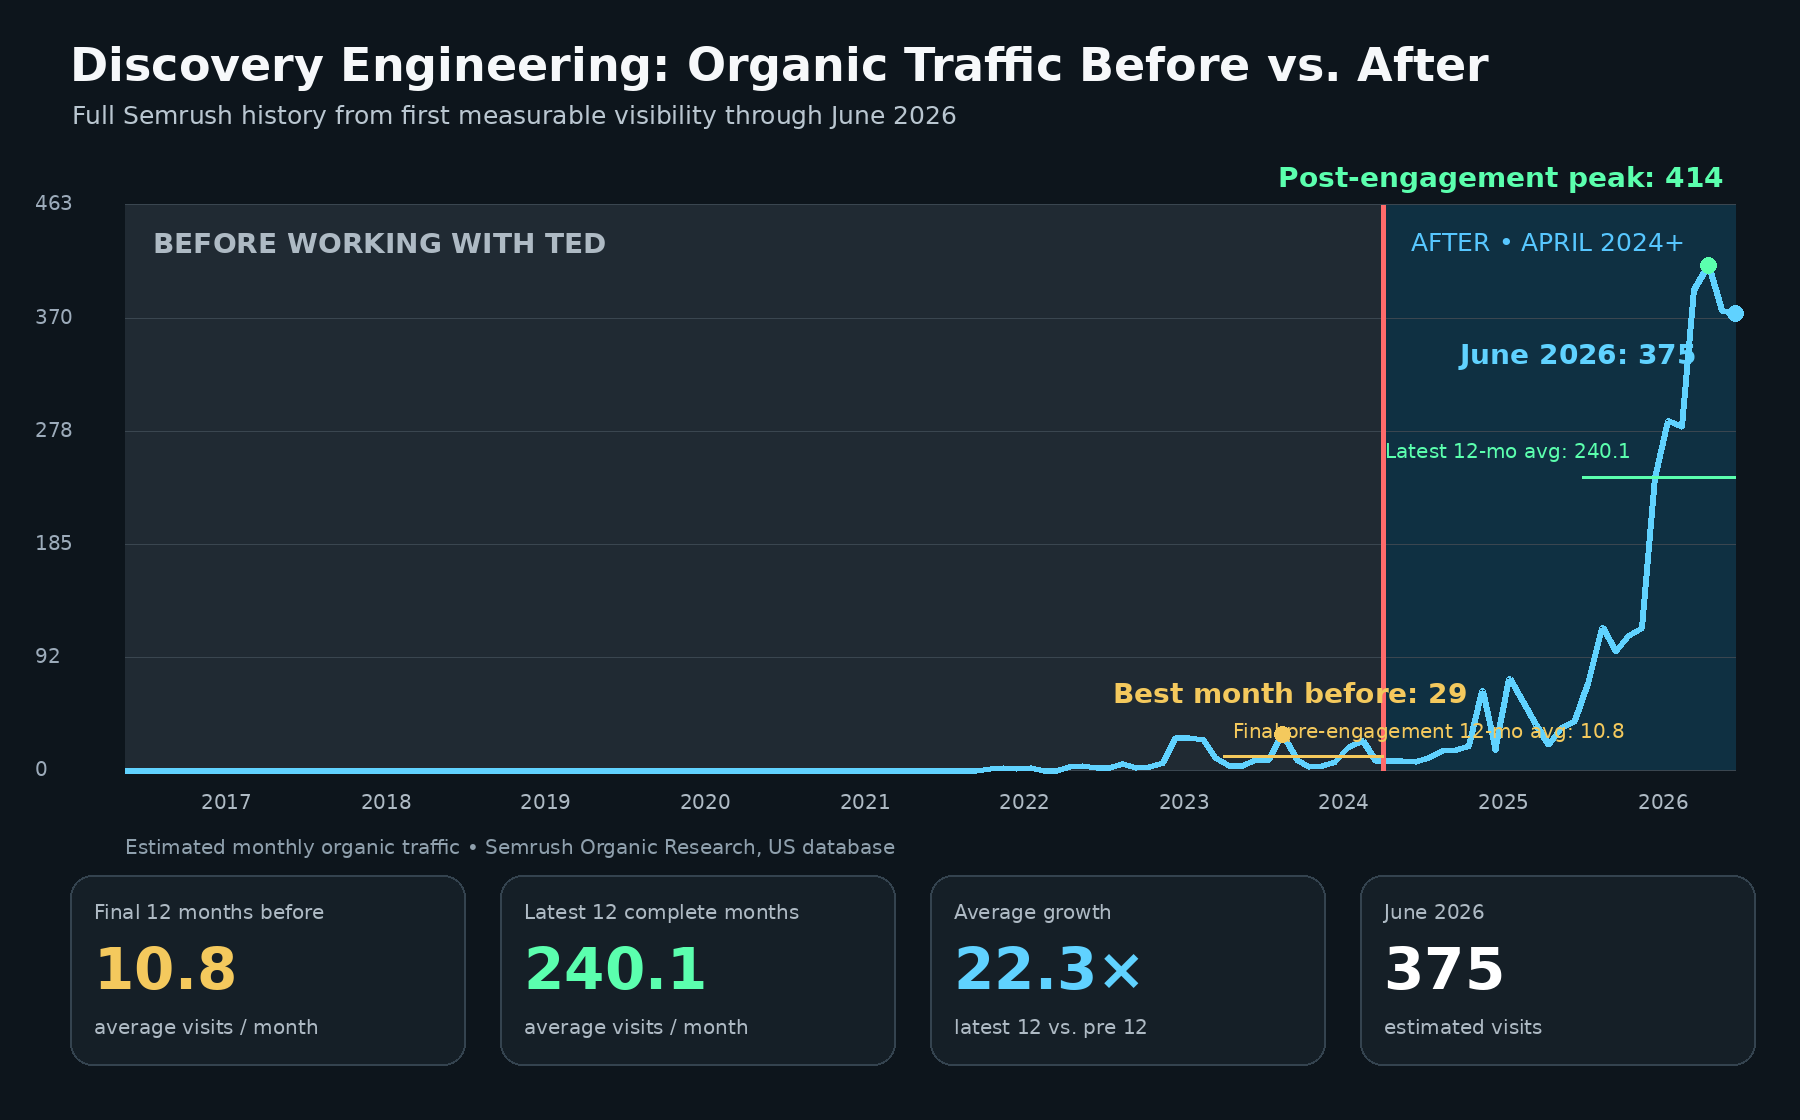
Before working with Precise Wolf Digital, Discovery Engineering had a limited organic footprint in Semrush. Across the 95 months before April 2024, estimated organic traffic averaged only 2.6 visits per month, with a median of zero.
The fairest recent baseline was the final 12 months before the engagement. From April 2023 through March 2024, Discovery Engineering averaged 10.8 estimated organic visits per month. In March 2024, the site had 8 estimated visits and 33 ranking keywords.
Solution: build search visibility around the right topics
The work focused on improving the site’s organic search footprint rather than chasing short-term traffic spikes. For a technical B2B service company, that means making the site easier for Google to understand and expanding the content around the problems, services, and decision criteria that prospective clients actually search for.
Step 1. Establish the real baseline
Instead of comparing one hand-picked month to another, the analysis used the full available Semrush history and a more recent 12-month pre-engagement baseline. That helped avoid overstating the results and made the before-and-after comparison more useful.
Step 2. Expand the keyword footprint
After the April 2024 start, Discovery Engineering’s ranking footprint expanded substantially. By June 2026, Semrush showed 1,257 ranking keywords, compared with 33 in March 2024.
Step 3. Turn visibility into sustained traffic potential
More ranking keywords translated into a stronger estimated organic traffic profile. By June 2026, Semrush estimated 375 monthly organic visits and $952 in monthly traffic value. The post-engagement traffic peak reached 414 estimated visits in April 2026.
Results: 22.3x higher latest 12-month average
- Before engagement: 10.8 estimated visits per month during the final 12 months before April 2024.
- After engagement: 240.1 estimated visits per month during the latest 12 complete months.
- Latest month: 375 estimated organic visits in June 2026.
- Keyword growth: 33 ranking keywords in March 2024 to 1,257 in June 2026.
- Peak after engagement: 414 estimated visits in April 2026.
The latest 12-month average of 240.1 estimated visits is 22.3 times the 10.8 average during the final year before the engagement. Even the weakest month in the latest 12-month period—71 estimated visits—was more than twice Discovery Engineering’s best month in the entire pre-engagement history.
What this means
The important story is not a single spike. It is the change in the site’s search baseline. Discovery Engineering moved from years of minimal measurable organic visibility to a broader, more durable search footprint after the engagement began.
Measurement note: Semrush figures are third-party estimates. They are useful for measuring search visibility, ranking keyword growth, and estimated traffic value, but they are not the same as verified leads, revenue, Google Search Console clicks, GA4 sessions, or CRM outcomes.
Have any questions or comments? Write them below!